Personal Finance Tracking
in Google Sheets
A brief look at how I use Google Sheets to help me understand and manage my money.
One day I’d like to be able to spend money without thinking about it. To not have to worry about every penny I earn going straight to bills. To be able to go and eat out without having to check my bank balance beforehand, or to buy something more than a bag of rice for lunch. Until then, I’ll keep tracking everything I can, to ensure the little money I have goes towards the right things.
It’s very easy to say ‘Don’t buy coffee everyday’ or ‘Just make a budget’, but to me, these comments don’t help. Many people, including myself, never buy coffee every day, so there’s nothing to be saved there. I’d love to make a budget, but that requires knowing how much is reasonable to spend on something. This is one of the reasons I started tracking my money, so I could understand what I was spending money on, and to see if I can save in any areas. I was already working 60+ hours a week, so increasing my income was going to be hard.
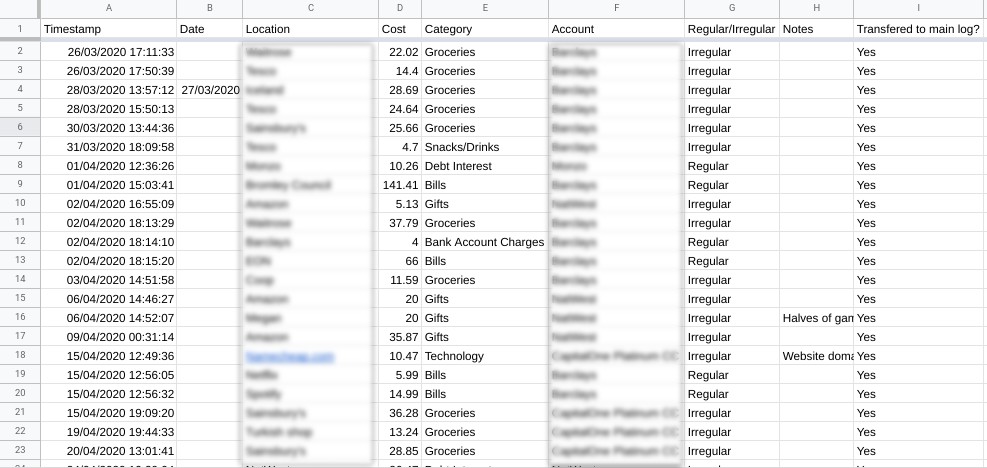
To gain these insights, to create graphs and statistics, to see trends, I needed data. This is the first step in anything. Just start writing down information. I began with a single spreadsheet. The columns were Date, Location, Cost, Category, Account, Notes. When did I buy something, where to, how much, and how did I pay?
After tracking these for a while, I started to build up enough of a log that I could start doing something with the data collected. I had enough to see how much I spent last week. Then, how much I spend last month. Then the last quarter, and so on. Recently, I just passed one year of tracking, so I can start to finally see how I’m doing in the long run. It’s very daunting to see a blank sheet, and wonder how you’ll ever fill it, but it fills itself, all you have to do is put in one row at a time, every time.
As of writing, I have 1677 rows in my expenses table, which represents roughly 13 months of tracking. This is enough for me to see valuable insights, such as my average expenses each month (in total, and broken down by category or account, etc.). This is valuable as I can now create a realistic and sustainable budget, rather than plucking numbers out of thin air.
Things get more powerful when combined with other data, such as logging my income and tracking my transfers between accounts. With this, I can create a reconciliation table to make sure nothing is coming out of my bank I don’t know about, and to make sure I’ve logged everything that has come out in my system.
Enough about why it’s a good idea, time to break down how it works.
The system is composed of a few parts:
Capture
As with most systems, making information capture as easy as possible is key to sustainability and reliability. To-do managers work well when you can get something out of your head ASAP, and accurate expense tracking is no different.
Of course, it’s easy enough just to open up the log and fill out a row when I’m on my laptop, but most of my spending is done out of the flat. So I had to find an easy way of inputting from my phone. For a while, I just had a shortcut to the Google Sheet on my home screen, which was OK. It was cumbersome and slow, and this resistance often made me decide not to input when I was out and about, but instead when I had a minute. Which did not work well.
There are ways of doing it using Todoist, my current to-do manager. The input and language processing is great, but linking it to GoogleSheets in a smooth way was going to be some work. It would also require some processing to split the logs up into the correct format. For now, I’ve settled on using a Google Form. I built a form and placed a shortcut to on my phone home screen. It only has fields for what is needed and has the default account and category set to my most common values.
The form responses occupy their own sheet in the workbook, and throughout the week I can copy them over to the main expense log. Of course, I could link the two, but this step allows me to make sure the input was correct and nothing needs editing. Maybe one day I’ll link them to allow real-time figures to be calculated.
Logs
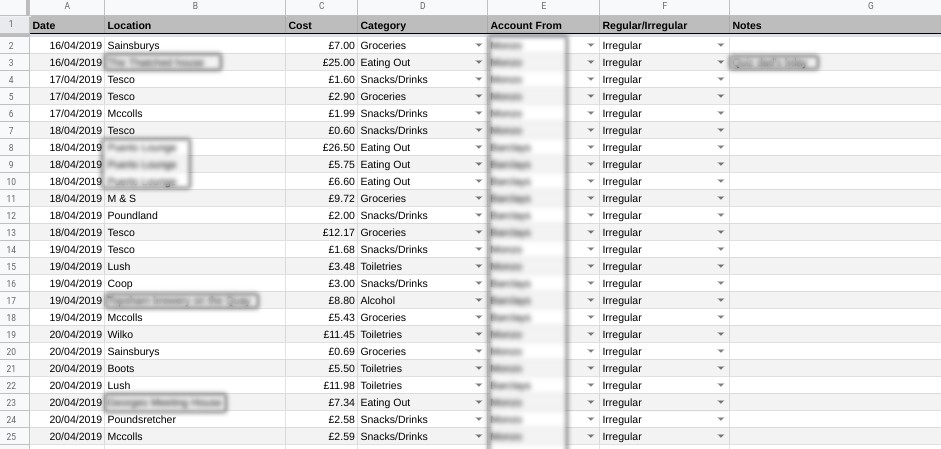
The most important part of the system - the data. This forms the base of everything. There are three log sheets: Expenses, Income, Transfers. They do what they say on the tin. ‘Expenses’ contains a table of any time I spend money on anything. From groceries or coffee to rent and travel. Cash, bank accounts, even gift cards.
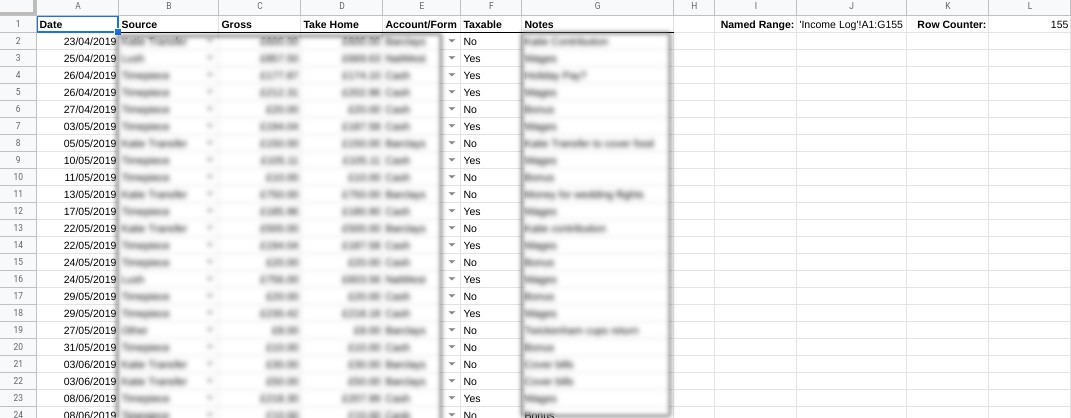
‘Income’ records any time I receive money in any form. When, where from, how much (gross and net), and in what form (account). The distinction between gross and net allows me to calculate things like my salary vs how much I take home. This is also where I include anything my partner transfers into our joint bank account. As I do not track her expenses, and therefore do not have access to her personal bank account. A transfer from her account to our joint account is treated as a form of income to the system.
‘Transfers’ covers the movement of money between the accounts. This is less important as it does not dictate how much I’ve received or spent. However, it does allow me to reconcile my bank accounts each week. It also allows me to model my bank balances if I ever need to. It also allows me to build a dashboard showing the location of my capital throughout the system. If I manage to move money into a savings account, I need that to show up on my current account balance, otherwise, I’ll be spending money that isn’t available.
Note: Credit cards can be a pain to handle, and there’s many ways of doing it. I have settled on the following: Treat them as a bank account, with each expense putting it further into a negative balance. Paying off the credit card from my current account should be treated as a transfer, but instead, I include them under expenses as this is the time the money is actually leaving my system. To make sure this isn’t double-counted I then have a rule which takes any expense record to a credit card company and treats it as a transfer within my reconciliation system. This isn’t elegant and will be fixed in the future.
Reconciliation
Now we’re getting on to some of the benefits of tracking. Keeping a log of my expenses, income and transfers by inputting them as they happen, instead of exporting a CSV from the bank, is valuable because it means I can compare the two logs. If there’s an expense from my bank account that isn’t on my personal log, I can investigate. 99% of the time I’ve just forgotten to log something, but occasionally it is something that should not have been charged to me, and I can now follow this up for a refund. This isn’t and common in the UK due to banking security and lack of fraud. However, when I visited the US I was nearly immediately the victim of fraud, with $100’s being charged to my account. Thankfully, I noticed this and contacted my bank for a refund.
The inverse happens too. I may have records of expenses on my personal log which don’t appear on my bank account. This could mean I have inputted something wrong (such as the wrong account or value), or I have doubled up a record by accident.
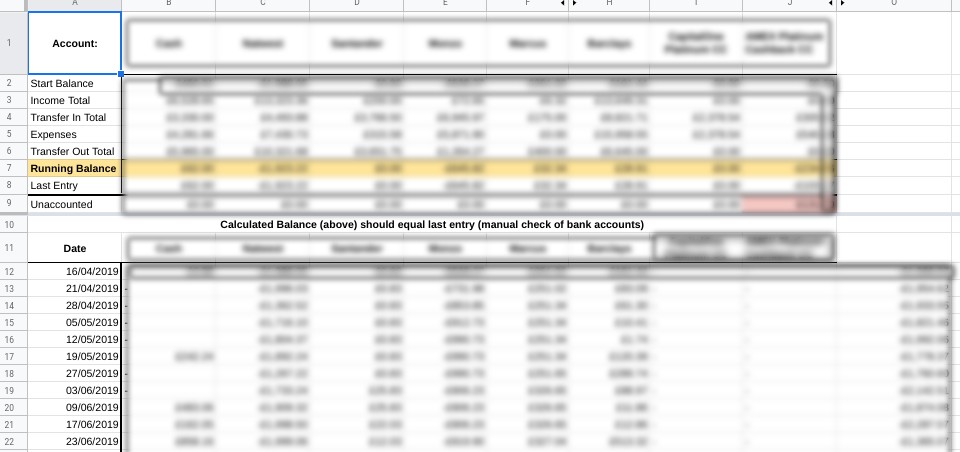
Carrying out a weekly reconciliation, comparing my bank balance to my calculated balance, allows me to keep this system accurate and in check. It also gives me time each week to sit down and review things. How much did I spend this week? Is there money in the right accounts for any bills coming up? And so on.
The image below gives an insight into how this all works. Many of these rows are normally hidden, however, they are displayed here for explanation purposes. The calculated or ‘running balance’ uses my starting balance, sums up all transfers going into an account including income, and takes away all transfers out and expenses. This gives me what my system thinks I should have. Then below this, I can enter what my bank says I actually have. If these two match then everything is good, if not, I need to do some digging.
Dashboard
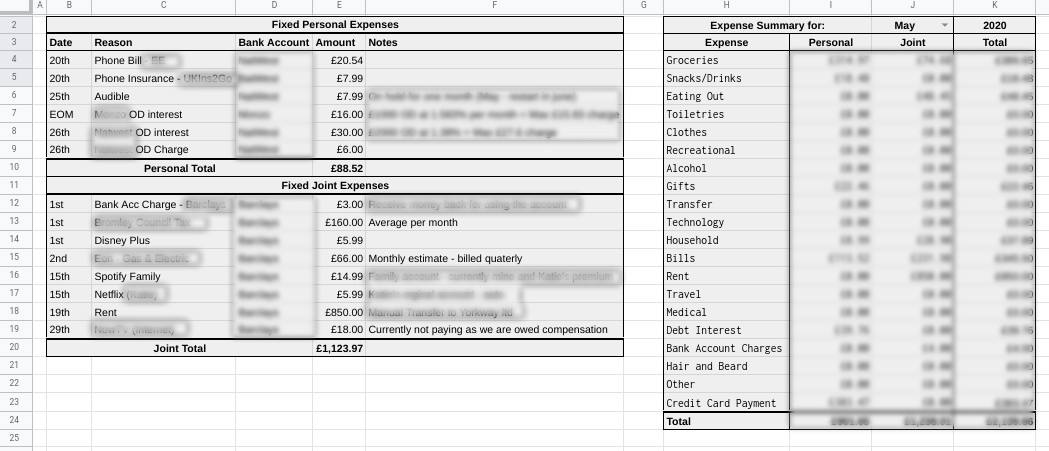
This is where a lot of the ‘work in progress’ is situated. Right now consists of two sheets. One is a summary of my expenses. It has two static tables and one dynamic table. The two static tables (left) show my regular expenses each month. These help me make sure I have enough money in a given account so any direct debits are not rejected. These tables are also referenced when modelling.
The table to the right is much more interesting. There are two drop downs at the top allowing me to select the year and month. Each cell in the table then queries the ‘Expenses’ sheet to return the total amount spent based on the criteria provided (date, category, account). The query groups the results by ‘Barclays’ and ‘not Barclays’ (as ‘Barclays’ is my joint account provider, this splits the data into expenses from my personal accounts and from the joint account.
Backend
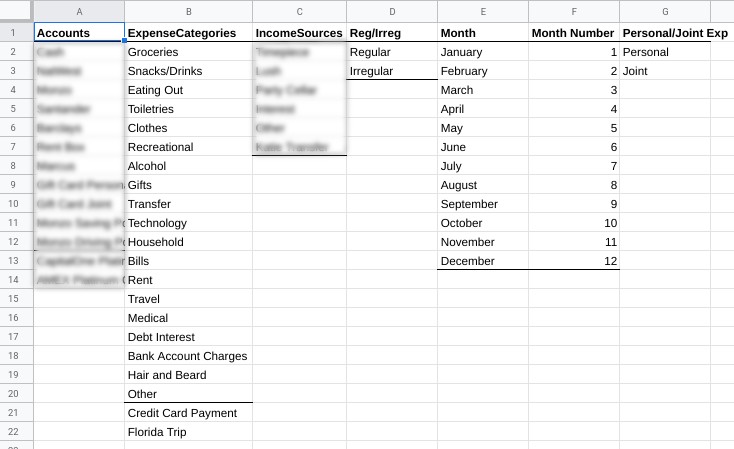
This section is more about metadata and making the system more reliable. In essence it just a single sheet used for validating data. There are many named ranges which just list certain variables that need to be constrained to given inputs. The most obvious being things like ‘Accounts’. This is just a list of all of my bank accounts, plus cash, gift card, etc. It allows the columns in the logs to only accept a valid account, helping the summary data easier to create. Another use for this sheet is the Month name-number lookup table. This isn’t needed for the system, but it makes it more user-friendly. When choosing a month in the Expense Summary table, it’s nicer to choose the name of the month with a drop-down, as opposed to typing the number of the month.
Documentation
This is more for my peace of mind than anything else. It’s really just a place to throw information that doesn’t yet have a home. A good example being information about my credit cards and credit score. I don’t have many cards, and my credit score was very low and I’ve now made an effort to improve it. But being in the UK, these things are not exactly important. So, for now, I just write out some things to have on the record, in case I ever need them. I also used to have a notes log of all of the changes I had made, and of features to include. I never kept up with it though, so I scrapped it. I then started a text file to do the same job, and then I binned that too. Ultimately, the current version of the system is what’s important. This is a bespoke system developed by me, for me, and can change when I need it to. Therefore, a changelog isn’t as valuable. Now I have this post, I can reference this as a README. I also use my to-do manager to record feature ideas I’d like to implement.
How does it connect
Leaving all of the logs unconnected would still work fine, but automating and validating data can save a lot of time and hassle. This is why spreadsheets are better than using a notebook. It's time to use some formulas and tools.
The first thing to do is make sure any inputs to the logs are valid. The best way to do this is using Data Validation. I use the lists in the Data Validation sheet as the condition. Then apply appropriate conditioning to the required columns. I use this on Accounts, Category, IncomeSource, Reg/Irreg. That last one just helps with the analysis.
The next thing to do is to keep the data grouped and tidy using named ranges. As of right now, Google Sheets doesn't have the 'table' features that Excel has. Meaning that adding a row to the bottom of a table does not mean it will automatically be included in a named range. This is why the cells to the right of the log tables are there. It is a work around for making sure any new data added is also added to the named range.
Take the income sheet for example. In Excel I could just create a table from the log and name it 'Income Log', and adding a new row of data would automatically adjust the size of the named range 'Income Log'. To make this happen in Google Sheets I did the following:
- Count the number of rows currently in the table using =COUNTIF(A1:A,"<>")
- In another cell write the following: ="'Income Log'!A1:G"&L1
- Where 'L1' is the reference to the cell containing the row count.
- Create a new named range from the drop down menu: ->Data -> Named ranges
- Set the name to Income Log in this case. And the range to be the cell that contains the text from above. Just that single cell. In this case 'J1'
This result can be seen in the Income Log screenshot from above.
What this is doing is creating a string to be passed to the Range field when creating a named range, instead of passing the range of cells itself. This string that we've made has the number of rows to include in the range, which is updated using the row counter cell.
The dasboard is made using the Query function. This is the formula for cell I4 on the Expense Summary sheet. It pulls the sum of expenses for all accounts exluding my joint account, for the dates given, and the category given.
=IFERROR(SUM(QUERY(INDIRECT(ExpenseLog),"SELECT C WHERE D = '"&$H4&"' AND E != 'Barclays' AND YEAR(A)=YEAR(date'"&TEXT(DATE($K$2,MONTH($J$2&1),1),"YYYY-MM-DD")&"') AND MONTH(A) +1 = "&VLOOKUP($J$2,'Data Validation'!$E$2:$F$13,2,0),0)),0)
The final major piece of connectivity between sheets is on the reconciliation page. The upper section of the table shows rows such as Income Total and Transfers Out Total. This just uses SUMIFS on particular logs. So, for example, the Income Total for the 'Cash' column would be =SUMIF('Income Log'!$E$2:$E, B$1, 'Income Log'!$D$2:$D).
The difference between the total in and total out is just the balance. This is then the balance I compare to my bank account.
The only detail is when it comes to the credit card accounts. The transfer totals will also include any expenses given to that company, as seen by the formula:
=FLOOR(SUMIF('Transfer Log'!$C$2:$C$1977, I$1, 'Transfer Log'!$D$2:$D$1977) + SUMIFS('Expense Log'!$C$2:$C$1953, 'Expense Log'!$B$2:$B$1953, "Capital One",'Expense Log'!$D$2:$D$1953, "Credit Card Payment"), 0.01)
The Future
You may notice that there’s some things missing, such as a budget. I am well aware that I do not have one. I keep going to make one, not finishing it due to thinking it isn’t good enough, and then scrapping it. This just shows that this whole thing is always a work in progress. It’s a dynamic living system that reacts to my needs. Having said that, this paragraph is a public commitment device: I shall build a budget and I shall stick to it.
I’m also missing some more detailed analysis of all of this data. I had started on a very comprehensive dashboard using Google Data Studio. But then life got in the way. Instead, I am now using this opportunity to re-learn Python and experiment with some Data Analysis in Google Colab. You can read more about that ongoing project here.