Personal Finances
Exploration
The first post in a series exploring my personal finances using Google Colab
Managing finances has always been important to me, both as a hobby and a learning exercise. Traditionally I have always used spreadsheets to record, store and analyse all of my expenses and income sources. This has pushed me to really understand how to push a spreadsheet to its limits, but there comes a point where it would be easier just to use Python.
The Current System
My current system is composed of a few main parts.
- Capture: I have a Google Form link on my phone’s home screen so I can input expenses on the go. The Form responses are stored in a sheet in my main finance workbook.
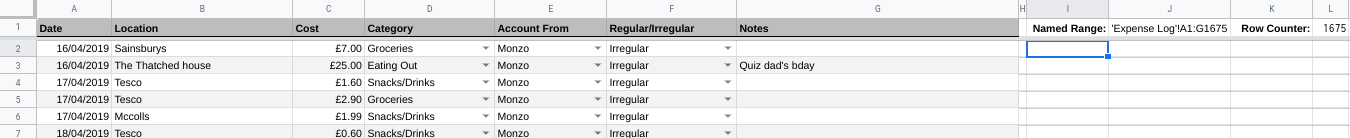
- Logs: I have three sheets (Expenses, Income, Transfers) which store the movement of any capital in my control. The expenses are for anything going out, income for anything coming in (including money my wife transfers into our joint account), and transfers cover movement between all of my accounts, including the joint account.
- Reconciliation: There is a reconciliation sheet which displays the calculated running balance for each account (using the three logs). Below is a table in which I input the actual balances from given by my online banking and counting any cash I have. These two numbers should match, and if they don’t it highlights any transactions I’m missing or have doubled up.
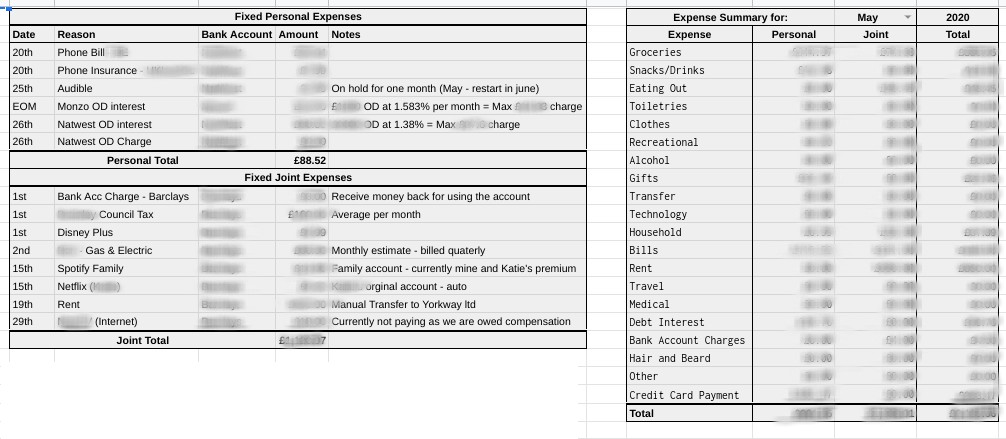
- Dashboard: In the past, I have experimented with many summaries or dashboard styles, including Google Data Studio. For now, I have downsized and simplified, showing a running balance and available balance for my accounts. Alongside is a table showing a summary of all of the expenses for a given month, with the option to change the month. There is also a table showing all of the regular expenses for each account (such as rent, bills, etc.) alongside the dates they are due.
- Backend: I have a couple of sheets which contain a bunch of metadata and information about running the system. It essentially consists of a table of information for data validation. It lists all of my accounts, expense categories, month name and number lookup tables. That kind of thing. This sheet is used for validating all of the inputs and making sure the data is consistent. If I open a new bank account or decide to add a new expense/income category, I go to this sheet and add it to the list.
- Documentation: Finally, I have some sheets dedicated to keeping notes about things I’d like to have a record of or features I would like to implement at some point. One example is a simple table listing all of my credit cards - the card name, company, opening date, opening credit score, credit limit, fees, and notes.
Amongst all of this complication is some really valuable insight into my spending and earning habits, as well as information that can help me budget better. Most of what I would like to do can certainly be done within the workbook, such as visualising expense breakdowns or working out how much tax I should have paid in a year.
However, given how big the data set is becoming, and how slow my laptop is, I have decided to use Google Colab to explore this in data in more depth.
Of course, this is not a permanent solution for creating a dashboard, for example, but it is a good exercise in Python and will give me some insights. It will allow me to create a more realistic budget, and there is certainly potential for a dashboard in the future.
Define the problem:
What am I looking to gain at the end of all of this?
I’d like to get an idea of where my money is going. To see a breakdown of which expense categories are eating the most money, and how has it changed of time. Am I spending more on food now I’m in lockdown?
What’s my net worth and is it going up or down?
Can I visualise my bank balances and predict what they will be in the short term future, using predictable expenses and maybe some unpredictable ones too?
What would a sensible budget look like, based on the income and expenses I have seen recently or will be seeing soon?
Data Availability:
What does the data source look like, and what can I do with it to answer the questions above?
Let’s take a look at some examples from my finance workbook that I described above.
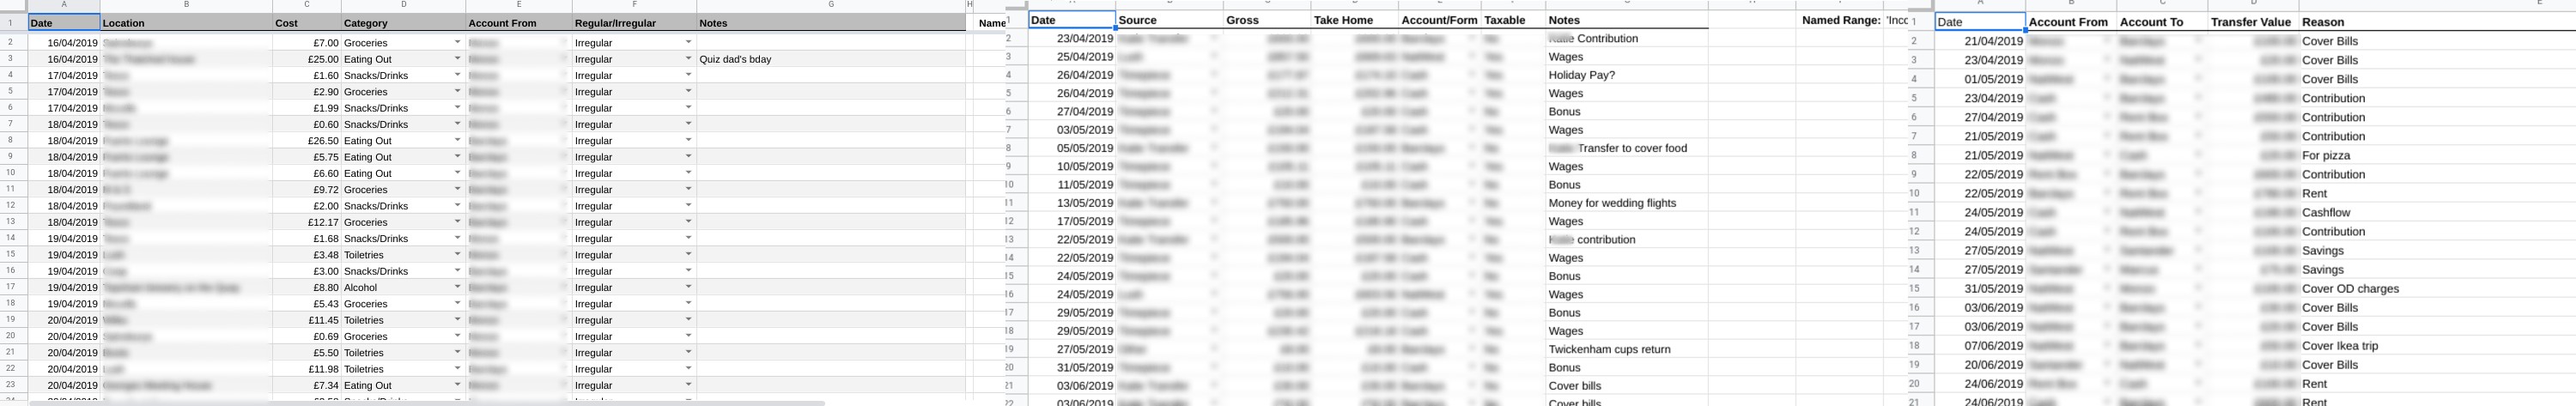
So we can see that when we import we ill need to clean up the table a little. I’ll also have to do some string formatting and data type conversions. I’ll likely have to combine and merge some tables depending on what I would like to do.
The Environment
Let’s set up the environment so we can get going. I’ll be using Google Colab, along with a few packages. I’ll be importing the data directly from my drive within the notebook, rather than downloading a CSV and importing it via a file. This means I can run this code and the data will be up-to-date each time.
First, I need to access the Google Sheets using the following code:
from google.colab import auth
auth.authenticate_user()
import gspread
from oauth2client.client import GoogleCredentials
gc = gspread.authorize(GoogleCredentials.get_application_default())
Next, the packages that I will need.
import pandas as pd
import matplotlib.pyplot as plt
import matplotlib.ticker as mtick
import numpy as np
import missingno
The final part of setup is bringing the data into Pandas to utilise the DataFrame object. I'll demonstrate with the 'Expense Log' to begin with, but the method applies to all of the logs I will be using.
#Import 'Personal Finance Tracking' sheet from drive
wb = gc.open_by_url('https://docs.google.com/spreadsheets/d/'[Redacted]'')
#Use Expense log sheet
sheet = wb.worksheet('Expense Log')
#Get all values in sheet
data = sheet.get_all_values()
Before this section is over, I'll take a quick look at what we've managed to import so far.
#Import into Pandas DataFrame and pull out columns headers and delete bad columns
df = pd.DataFrame(data)
df.head()

Conclusion
I can see this project being a long one, so I think it would be a good idea to break this into multiple sub-projects/articles. It is safe to say that there is certainly enough data to get going and pull some useful information our though. I’m eager to explore my financial situation, see how I can use this exercise to improve my position, and also to expand my Python knowledge whilst I’m at it.
Next up, EDA.