Weight Loss
Visualisation
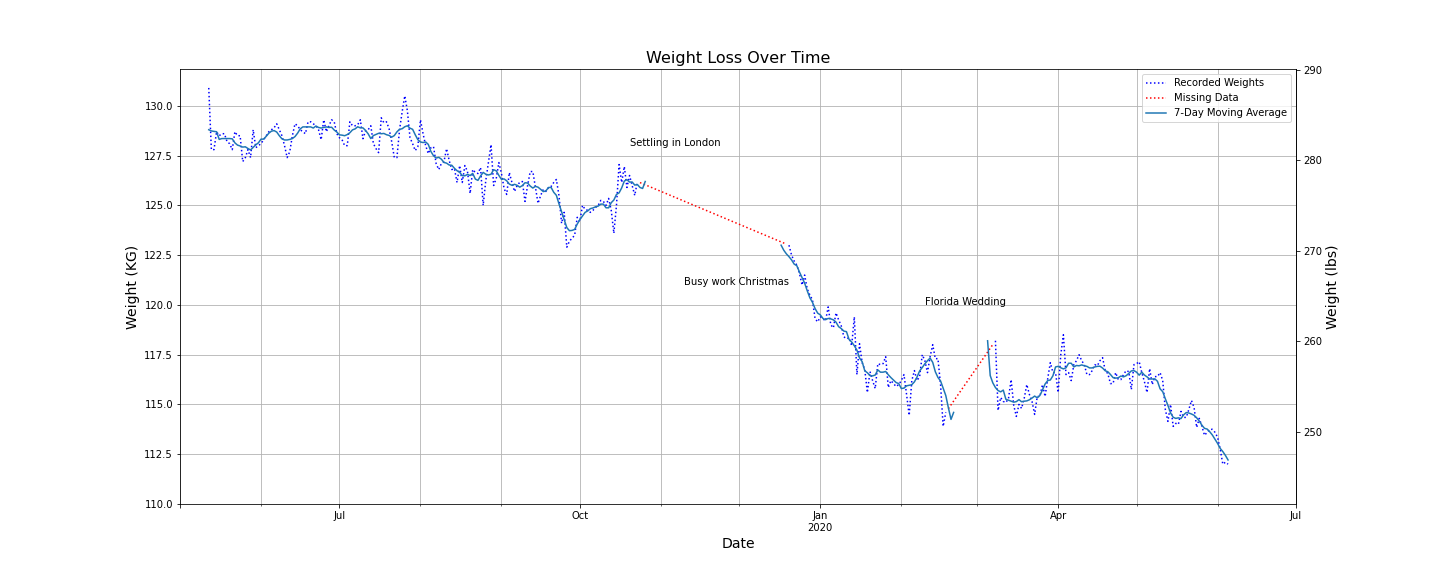
Plotting my daily weight log from Google Sheets, using pandas and matplotlib in Google Colab

I have been logging my weight every morning in a Google Sheets worksheet, along with occasional body measurements. I've been tracking for over a year now and I thought it about time I look at what's changed.
Off the back of some programming courses, this would be my first stand alone Python project exploring data. It was simple enough, just one set of time-series data that needed plotting.
My current setup is a pretty slow Chromebook, something I've never programmed on before. So I decided the easiest route was to use Google Colab, which uses Jupyter notebooks, and let them do all of the processing work.
And below is the final output:
The Colab notebook and csv can be found here